File:Saccadic main sequence.png

Original file (768 × 768 pixels, file size: 65 KB, MIME type: image/png)
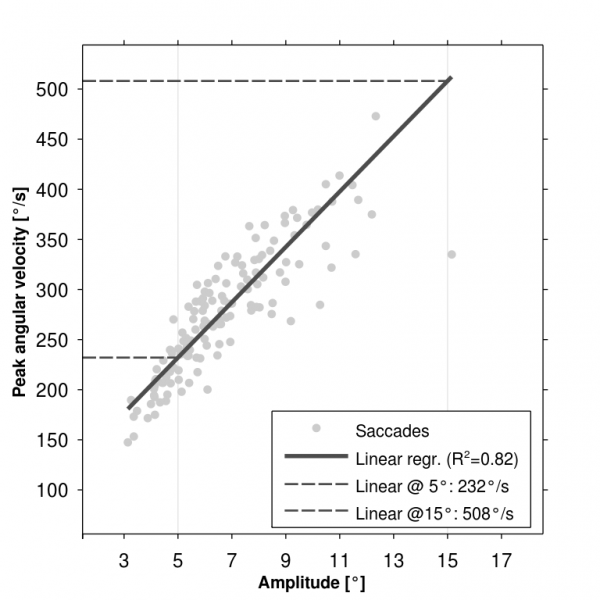
Description English: The data shows single saccades of a participant from a visually-guided saccade task. The main sequence was computed using a robust linear regression. The coefficient of determination is computed similar to ordinary least squares regression. The peak velocities in the legend are computed for amplitudes at 5° and 15° from the resulting regression coefficients. The saccade data was gathered using an infrared limbustracking device at the Pupils lab for Neuroscience, Tuebingen, Germany. Date 21 January 2015 Source Self-generated plot using Matlab R2008a Author InkassoSchroeder
Permission is granted to copy, distribute and/or modify this document under the terms of the GNU Free Documentation License, Version 1.2 or any later version published by the Free Software Foundation; with no Invariant Sections, no Front-Cover Texts, and no Back-Cover Texts.
This file is licensed under the Creative Commons Attribution-Share Alike 4.0 International, 3.0 Unported, 2.5 Generic, 2.0 Generic and 1.0 Generic license.
File history
Click on a date/time to view the file as it appeared at that time.
| Date/Time | Thumbnail | Dimensions | User | Comment | |
|---|---|---|---|---|---|
| current | 08:20, April 15, 2019 | | 768 × 768 (65 KB) | Bayan.Al Othman (talk | contribs) | Description English: The data shows single saccades of a participant from a visually-guided saccade task. The main sequence was computed using a robust linear regression. The coefficient of determination is computed similar to ordinary least squares r... |
You cannot overwrite this file.
File usage
The following page uses this file: